Property tax
Property tax rates
There are multiple ways to compare property tax rates across states, as seen in the following table reproduced from the Lincoln Institute of Land Policy.
| Statistic | New York | U.S. average | Rank (of 51) 1 is highest |
|---|---|---|---|
| Per capita property tax | $3,343 | $1,898 | 3 |
| Property tax percentage of personal income | 4.4% | 3.1% | 6 |
| Total property tax as percentage of state-local revenue | 18.60% | 15.5% | 9 |
| Median owner-occupied home value2 | $340,600 | $244,900 | 9 |
| Median real estate taxes paid for owner-occupied home2 | $5,884 | $2,690 | 4 |
| Effective tax rate, median owner-occupied home3 | 1.70% | 1.10% | 8 |
Sources: U.S. Census via Significant Features of the Property Tax, American Community Survey
- All revenue numbers in this table include the state government as well as local governments.
- The statistics for median owner-occupied home value and median real estate taxes paid for owner-occupied home are five-year average statistics for years 2017–2021.
- Calculated as the median real estate tax paid on owner-occupied homes as a percent of the median owner-occupied home value.
Property taxes fund local programs and services
Property taxes in New York State support school districts, local governments, special districts (such as fire districts), and other local services.
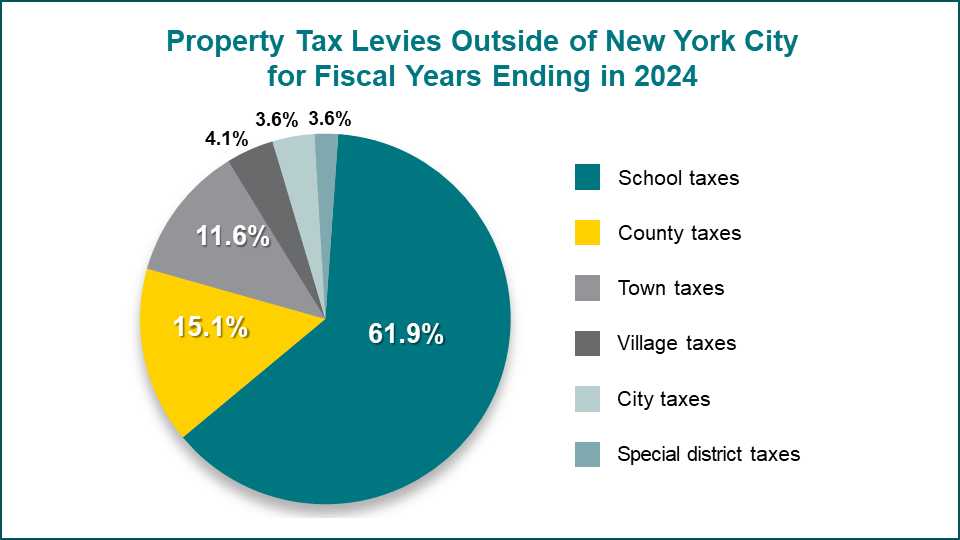
Property tax levies outside of New York City for fiscal years ending in 2024. School taxes, county taxes, town taxes, village taxes, city taxes, and special district taxes. For exact numbers, see data table.
Working with local government
New York State does not receive any revenue from the property tax, but the Tax Department's Office of Real Property Tax Services (ORPTS) supports the more than 1,000 local governments that do.
Note: The decline observed between 2022 and 2023 is due to a lower levy in New York City, as published by the Office of the State Comptroller.
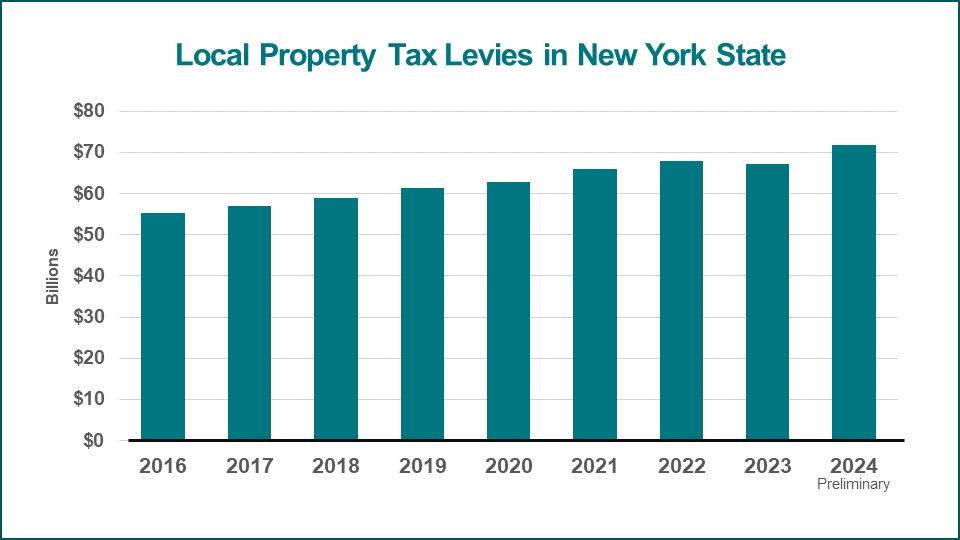
Local property tax levies in New York State from 2016 to 2024 preliminary. For exact numbers, see data table.
Types of properties in New York State
There are more than four million residential properties in New York State, and there is small but steady growth each year. The residential category includes one, two, and three-family homes, as well as manufactured homes and seasonal residences. Apartment buildings are included in the commercial category. For details, see Property type classification codes.
| Calendar year | 2019 | 2020 | 2021 | 2022 | 2023 | 2024 |
|---|---|---|---|---|---|---|
| Number of residential properties | 4,000,105 | 4,006,163 | 4,013,060 | 4,021,536 | 4,032,628 | 4,039,868 |
| Annual growth | 0.15% | 0.17% | 0.21% | 0.28% | 0.18% |
More than two-thirds of all New York properties—and more than 80% of property sales—are residential. However, in terms of acreage, residential properties are 30.5% of the total while agriculture is 17.6% (compared to 5.8% of the total number of properties and only 1% of total sales).
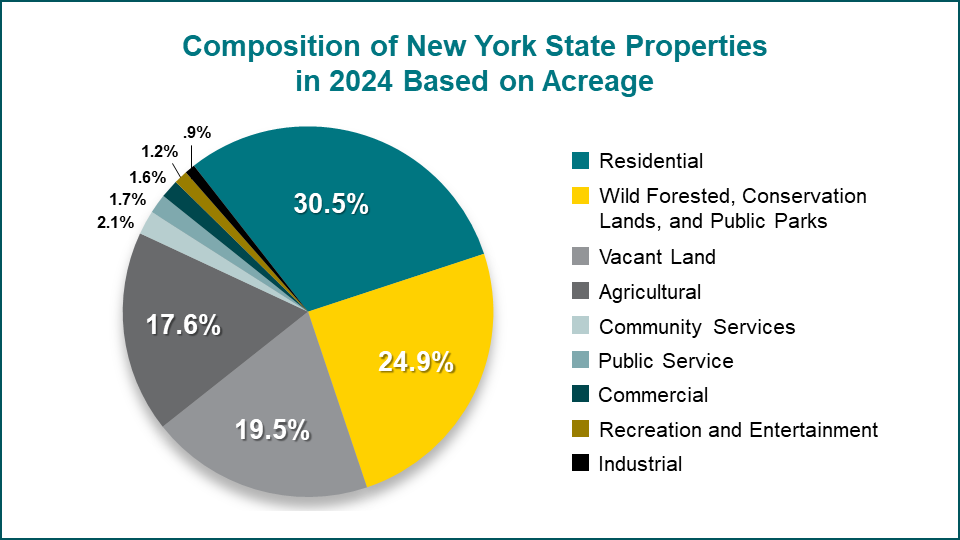
Composition of New York State properties in 2024 based on acreage. For exact numbers, see data table.
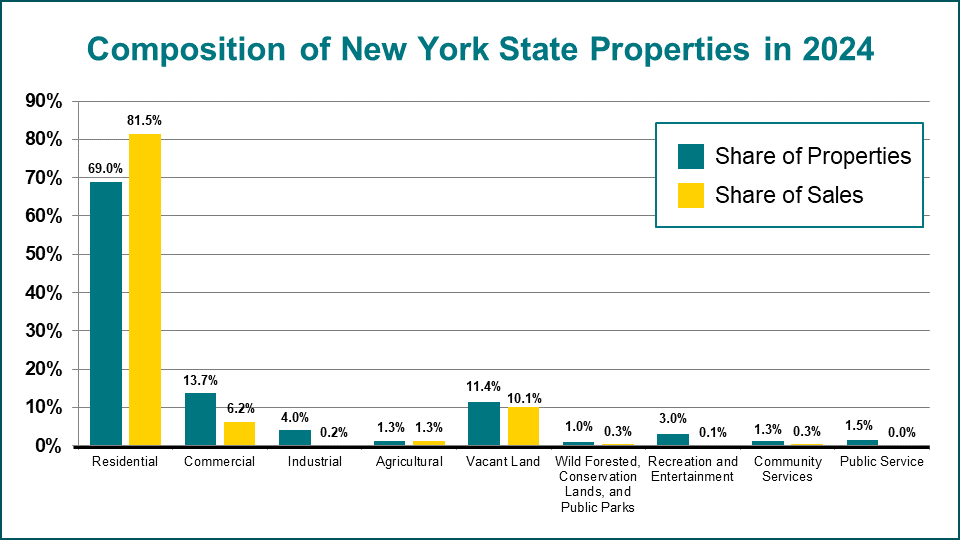
Composition of New York State properties in 2024. Share of properties, share of sales, and share of acreage. For exact numbers, see data table.
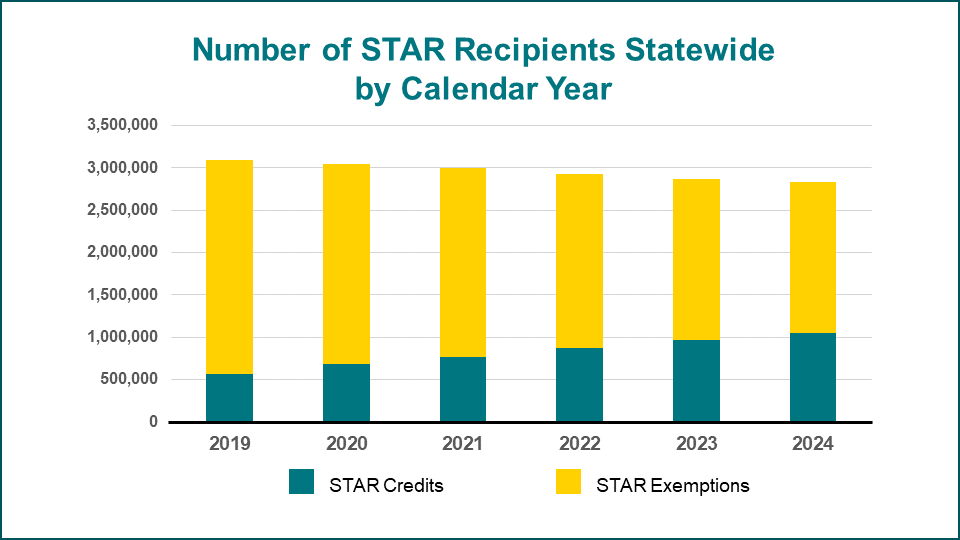
Senior citizens with incomes of $93,200 or less were eligible for Enhanced STAR benefits in calendar year 2024. The number and proportion receiving the enhanced benefit increased noticeably over the last five years.

Share of enhanced STAR recipients by calendar year from 2019 to 2024. For exact numbers, see data table.
The STAR program returned more than $2.2 billion to property owners in 2024.
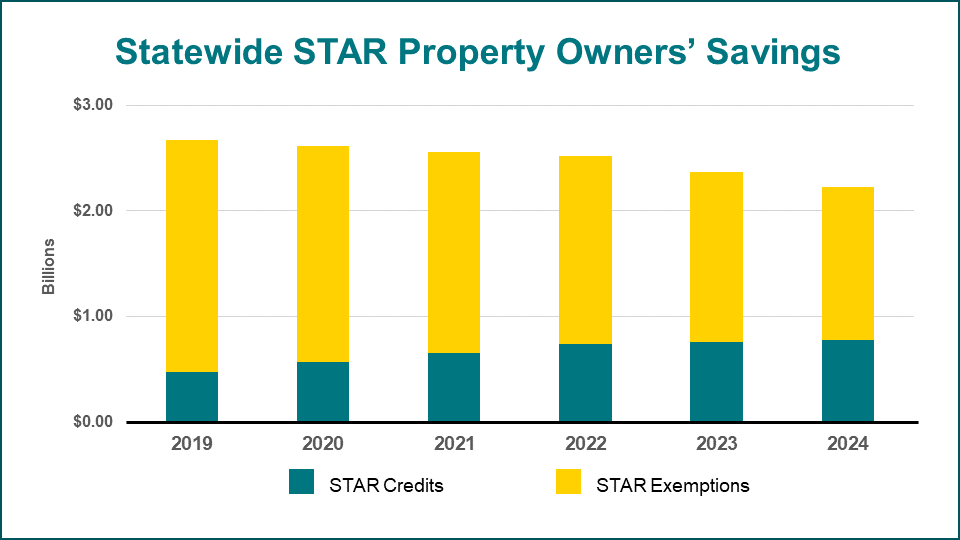
Statewide STAR property owners' savings. STAR credits and STAR exemptions from 2019 to 2024. For exact numbers, see data table.